FOAMSCAN™ - Foam Analyzer for Foamability, Foam Stability, Drainage, and Bubble Size Analysis.
Go beyond just looking at your foam. Understand why it behaves the way it does — so you can control it
A foam is not a static object. From the moment it is created and reaches its zenith, it begins to evolve and change — liquid drains from the film network under gravity, gas diffuses from smaller bubbles to larger ones through Ostwald ripening, and films thin until they rupture and bubbles coalesce. These processes happen simultaneously, at different rates, and their relative contributions determine how the foam behaves and how long it persists. A foam that collapses in seconds and a foam that survives for hours may differ not in whether these mechanisms are present, but in which one dominates and how quickly it progresses.
This is why just watching foam height — whether in a graduated cylinder or on a camera — cannot tell you what you actually need to know. Foam height tells you the net result of everything happening inside the foam, but it cannot tell you why the foam is decaying, which mechanism is responsible, or where in the foam column the instability originates. Two foams can lose volume at the same rate for entirely different reasons, and the formulation response to each would be different.
To separate these mechanisms and understand what is actually governing your system, you need more than one type of measurement, and you need them simultaneously, from the same foam, in the same experiment. The FOAMSCAN combines continuous optical imaging with continuous conductivity measurement along the foam column. Optical imaging captures foam volume, foam height, and bubble size distribution in real time. Conductivity measurement captures liquid fraction and drainage independently — because conductivity through the foam is determined by how much liquid remains in the film network, not by how tall the foam is. Together, these two measurement methods give you the ability to distinguish between a foam that is losing volume because liquid is draining out and a foam that is losing volume because bubbles are coalescing — a distinction that foam height alone cannot make.
This dual measurement approach — optical and conductivity, running continuously and simultaneously — is the foundation of every FOAMSCAN measurement. It is what connects the macroscopic behavior you can see (foam volume, foam height, decay rate) to the microscopic processes you cannot (drainage kinetics, coarsening, film rupture), and it is what makes the difference between observing your foam and understanding it.
“When you can measure what you are speaking about, and express it in numbers, you know something about it; but when you cannot express it in numbers, your knowledge is of a meagre and unsatisfactory kind..”
— Lord Kelvin, Lecture on Electrical Units of Measurement, 1883
Foam Generation
Reproducible foam analysis begins with reproducible foam generation. If the method of foam creation varies from run to run — in gas flow rate, in shear intensity, in timing — the stability data will reflect that variability, not your formulation. Generating foam the same way every time, with precisely defined and repeatable parameters, is the foundation that makes every subsequent measurement meaningful.
The FOAMSCAN provides three distinct foam generation methods, each suited to different applications and research objectives. Gas sparging injects gas through a porous glass filter at a defined flow rate, producing foam by bubbling through the liquid — the most common and most reproducible method for general foam characterization. Mechanical stirring generates foam by agitating the liquid in a stirring chamber at a defined RPM, which more closely replicates the shear-driven foam generation encountered in many industrial processes. External foam generation allows foam produced by any method outside the instrument — a blender, a pilot-scale mixer, a process sample — to be introduced into the measurement column for analysis.
The choice of foam generation method is not arbitrary. The same solution can produce foams with different bubble size distributions, different initial liquid fractions, and different stability profiles depending on how the foam is created. But equally important is the ability to set precise generation parameters — flow rate, shear speed, duration, volume — and have the instrument reproduce them identically from experiment to experiment. The FOAMSCAN does both: it lets you choose the generation method that matches your real-world process, and it ensures that the conditions are defined and repeatable, so that the differences you measure between samples reflect formulation differences — not procedural ones.
FoamScan Foam Foamability and Stability Measurement Generated Via the High Speed Mechanical Stirring Foam Generation Method
Foam Volume and Stability
The FOAMSCAN continuously tracks foam volume, liquid volume, and foam height from the moment foam generation begins through equilibration and decay. From these primary measurements, the software calculates the derived parameters that characterize both foamability and foam stability: foam capacity, expansion coefficient, foam density, and the stability indices — Foam Stability Index and Bikerman Index — that allow quantitative comparison between formulations.
Foamability and foam stability are distinct properties, and the FOAMSCAN measures both. A solution with high foamability may produce a large initial foam volume that collapses rapidly. A solution with lower foamability may produce a smaller foam that persists for hours. Understanding this distinction — and having quantitative values for both — is essential for any application where foam behavior needs to be optimized, whether the goal is maximum foam generation, maximum stability, controlled decay, or rapid collapse.
For defoamer and antifoam evaluation, the FOAMSCAN provides a direct, quantitative assessment of antifoam effectiveness. You can measure foam volume and stability with and without the antifoam agent under identical generation conditions, and the difference is the answer — not a subjective judgment, but a number.

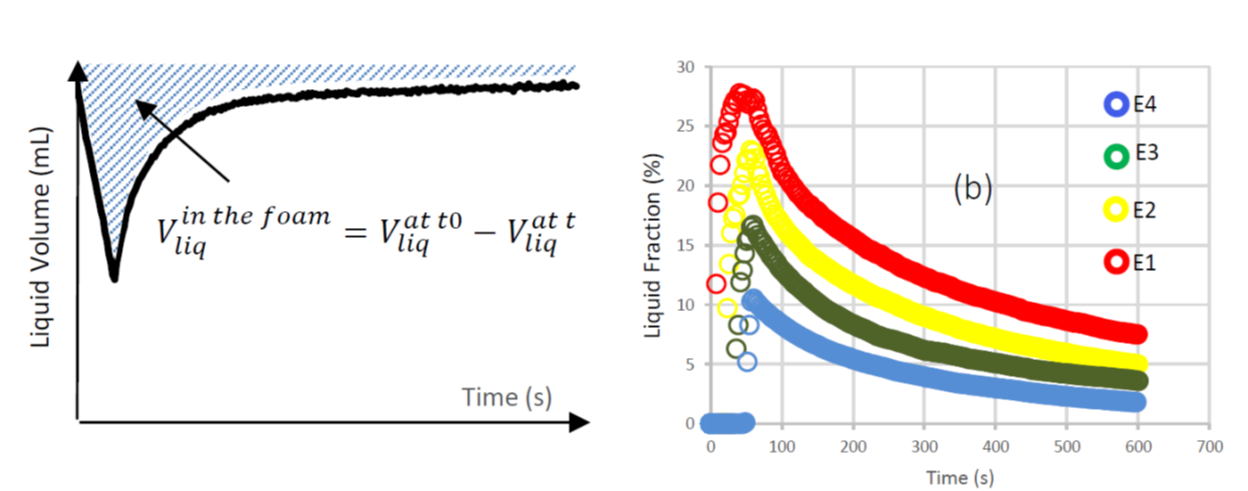
Drainage and Liquid Fraction
Drainage is the process by which liquid flows downward through the foam's film network under gravity. It is one of the primary mechanisms of foam destabilization, because as liquid drains, the films between bubbles become thinner, weaker, and more susceptible to rupture. But drainage alone does not destroy a foam — it sets the conditions under which coalescence and coarsening can accelerate. Understanding drainage kinetics is therefore essential to understanding the overall stability of the system.
The FOAMSCAN measures drainage through conductivity sensors positioned along the foam column. Because the electrical conductivity of a foam is determined by how much liquid is present in the film network, conductivity provides a direct, continuous measurement of liquid fraction — independent of foam volume, independent of foam height, and independent of what is happening at the top or bottom of the column. This is information that no optical method can provide, because optical imaging sees the outer surface of the foam but cannot see how much liquid remains inside.
By combining the conductivity-derived drainage profile with the optically measured foam volume, the FOAMSCAN begins to separate these mechanisms. If foam volume is decreasing while liquid fraction is also decreasing, drainage is likely the dominant process — liquid is leaving the foam, and the films are thinning. If foam volume is decreasing but liquid fraction remains relatively constant, something else is happening — bubbles may be rupturing or coalescing, and the foam structure itself may be failing. This distinction narrows the diagnosis significantly, but confirming the mechanism — and identifying whether coalescence, Ostwald ripening, or both are at work — requires one more piece of information: what is happening to the bubbles themselves. That is what the Cell Size Analysis imaging provides.
Bubble Size and Distribution
Bubble size is one of the most revealing indicators of foam evolution because changes in the bubble-size distribution directly reflect the destabilization processes occurring inside the foam. The FOAMSCAN's Bubble Size Analysis (BSA) imaging system captures the bubble-size distribution at user-selected column heights and tracks how it evolves over time.
In a stable foam, the bubble size distribution changes slowly and predictably. In an unstable foam, the distribution shifts — and the nature of that shift tells you which mechanism is driving the instability. A gradual, uniform increase in average bubble size suggests Ostwald ripening — gas diffusing from smaller, higher-pressure bubbles to larger, lower-pressure ones. An abrupt appearance of very large bubbles within a population of smaller ones suggests coalescence — films rupturing and adjacent bubbles merging. These are distinct physical processes with different causes and require different formulation responses; BSA imaging allows you to distinguish between them directly.
Combined with the drainage and foam volume data from the optical and conductivity measurements, the evolution of bubble size and distributions completes the picture. You can now determine not just that your foam is decaying, but through which mechanism, at what rate, and at what point in the foam's life the transition from one dominant mechanism to another occurs.
A drainage problem is addressed through film thickness and viscosity. A coalescence problem is addressed through interfacial elasticity and surface coverage. An Ostwald ripening problem is addressed by considering gas solubility and bubble-size uniformity.
This level of understanding turns foam characterization from a screening exercise into a genuine formulation tool.
Detergent Foam Bubble Size Analysis Measurement
Automated Cleaning
Residual surfactant contamination between experiments is one of the most common — and most underappreciated — sources of irreproducibility in foam analysis. Surfactants are designed to adsorb strongly to surfaces. When the same measurement column, filter, and tubing are used for successive experiments with different formulations, trace amounts of the previous sample can remain on wetted surfaces and alter the results of the next measurement. The effect is subtle enough to be mistaken for normal variability, which makes it particularly insidious.
The FOAMSCAN includes an automated multi-solvent cleaning system that flushes the entire liquid pathway — column, filter, tubing, and drain — between experiments. The cleaning sequence can be programmed with multiple solvents and rinse cycles, and it runs without operator intervention. There is no need to disassemble the column, no manual rinsing at a sink, and no operator exposure to solvents or chemicals. One experiment ends, the cleaning cycle runs, and the next experiment begins — from the same workstation, with a clean system, ready for the next sample.
The practical impact on laboratory throughput is substantial. What traditionally requires disassembly, manual cleaning, drying, and reassembly between every run is reduced to an automated sequence that runs in the background. For laboratories evaluating multiple formulations, surfactant candidates, or defoamer concentrations in a single session, this is the difference between characterizing a handful of samples per day and characterizing significantly more — with better data quality on every one.
This is not a convenience feature. It is a measurement integrity feature and a productivity feature. When you compare two formulations measured on the FOAMSCAN, you can be confident that the difference you see is real — not an artifact of what was in the column before.
Automated Foam Column Cleaning Process
Elevated Temperature and Pressure
Many foam applications operate above ambient conditions. Food processing, beverage production, enhanced oil recovery, firefighting foams, and industrial cleaning all involve temperatures and pressures where foam behavior can differ significantly from what you observe at room temperature and atmospheric pressure.
The standard FOAMSCAN operates at atmospheric pressure and at temperatures up to 90°C using an external heating circulator. For many foam characterization applications — surfactant screening, defoamer evaluation, formulation optimization — this range covers the conditions of interest.
For applications that require foam characterization at elevated temperatures and pressures, the FOAMSCAN HTMP is a dedicated instrument configuration designed for these demanding conditions, with all measurement capabilities—optical imaging, conductivity, and bubble size analysis—fully operational. For detailed specifications, visit the FOAMSCAN HTMP product page.
Every measurement described on this page — foamability, foam stability, drainage, liquid fraction, bubble size distribution, and their evolution over time — comes from a single foam column, analyzed by continuous optical and conductivity measurement running simultaneously. The FOAMSCAN does not ask you to choose between macro and micro analysis, between foamability and stability, or between observing your foam and understanding it. It gives you all of this, from the same foam, in the same experiment.
If you want to go beyond just looking at your foam — to understand why it behaves the way it does and to control how it performs — we would welcome the conversation.