Why the Same Defoamer Can Perform Completely Differently in Two Surfactant Systems — and What That Means for How You Test
When Foam Is the Problem
Foam is desirable in some applications — the head on a beer, the lather of a shampoo, the expansion of a firefighting blanket. But in many industrial processes, foam is an obstacle. It reduces vessel capacity, interferes with mixing and heat transfer, disrupts distillation and evaporation systems, slows filling lines, and creates safety hazards. In paper manufacturing, pharmaceutical production, food and beverage processing, coatings, crude oil handling, lubrication systems, and wastewater treatment, controlling unwanted foam is not optional — it is a process requirement.
The chemical additives used to suppress or destroy unwanted foam fall into two broad categories, and the distinction matters: antifoam agents, which prevent foam from forming, and defoamers, which destroy foam that has already formed. Antifoam agents are pre-dispersed into the foaming liquid before processing. Their role is to prevent foam from forming in the first place — or to limit the amount and stability of foam that does form. Defoamers are applied directly to existing foam, typically at the surface, to collapse it by rapidly destabilizing the foam films. In practice, the same chemical can sometimes serve both functions depending on how and when it is introduced, but the mechanism of action and the timing are different.
Common antifoaming substances include insoluble oils, polydimethylsiloxanes (PDMS), and other silicones, alcohols, stearates, glycols, and various blended formulations that combine multiple active ingredients. The chemistry is diverse, and the effectiveness of any given additive depends not just on its own properties but on the foaming system it is added to — the surfactant type and concentration, the ionic environment, the temperature, the method of foam generation, and the specific interactions between the defoamer and the surface-active species at the interface.
This last point is the one that is most often underappreciated. A defoamer that works well in one system may be partially effective, ineffective, or even counterproductive in another. Defoamer performance is not an intrinsic property of the defoamer. It is a property of the defoamer-surfactant system as a whole.
The Problem with Subjective Testing
Given how system-dependent defoamer performance is, the only reliable way to select the right additive at the right concentration for a specific application is to test it under controlled, reproducible conditions, with quantitative measurements that allow meaningful comparison between candidates.
This is where conventional testing methods fall short. The most common approach in many laboratories is still a variation of a visual or semi-quantitative foam test: generate foam in a graduated cylinder or beaker, add the defoamer, and judge the result by eye. Did the foam collapse? How fast? How much? The answers to these questions depend on who is watching, how the foam was generated, when exactly the defoamer was added, and how the observer interprets what they see. Different operators will produce different results even when they believe they are following the same procedure.
For initial screening — deciding whether a candidate is worth investigating further — this may be adequate. But for dosing optimization, quantitative comparison between candidates, determining how long a defoaming effect persists before the foam recovers, and generating data to support a procurement decision or a manufacturing specification, subjective observation is insufficient. You need numbers, and you need them to be reproducible.
A Real Example: Same Defoamer, Two Systems, Different Answers
A recent study illustrates this problem clearly. A single antifoaming agent was tested at four concentrations (25, 125, 250, and 500 ppm) in two different surfactant solutions. The defoamer was pre-dispersed in each solution before foam generation, making this an antifoam evaluation.
The two surfactant systems were chosen to represent different chemistries and different micellization regimes. The first was Rhodafac RE 610, a phosphate ester of nonylphenol ethoxylate, prepared at 8 g/L in water — a concentration corresponding to approximately 889 times its critical micelle concentration (CMC). The second was Pluronic F127, a nonionic EO/PO/EO triblock copolymer, prepared at 2 g/L in water — approximately 8.7 times its CMC. Both solutions foam readily on their own, but the surfactant chemistry, the molecular architecture, and the degree of micellization are fundamentally different.
Foam was generated by sparging air through a porous glass filter (porosity of 16–40 µm) at a controlled flow rate of 100 mL/min, using a user-defined protocol — gas injection until a target foam volume of 150 mL was reached. The foaming time — how long it took to reach the target volume — served as the measure of the defoamer's effect on foamability. The foam half-life — the time required for the foam volume to decay by 50% after sparging stopped — served as the measure of its effect on foam stability. Each measurement was performed in triplicate to ensure statistical reliability, and an automated full column cleaning cycle was run between experiments to eliminate residual contamination.

Results: Rhodafac RE 610
In the Rhodafac RE 610 system, the defoamer had no measurable effect at 25 ppm — the foaming time was 85 seconds, essentially identical to the 86-second baseline. At 125 ppm, a modest effect appeared: foaming time increased to 101 seconds. At 250 ppm, the effect became more pronounced (191 seconds), and at 500 ppm, the foaming time increased to 570 seconds — roughly 6.6 times longer than the baseline.
The foam stability data tells a complementary story. At 0 and 25 ppm, the foam remained stable and did not reach the 50% decay threshold within the measurement window. At 125 ppm, foam half-life became measurable — 788 seconds — and decreased with increasing concentration: 661 seconds at 250 ppm and 465 seconds at 500 ppm. The defoamer destabilized the foam, but even at the highest concentration tested, foam still formed and persisted for several minutes before losing half its volume.
The final baseline measurement — Rhodafac without defoamer, run after the 500 ppm experiment and its cleaning cycle — returned a foaming time of 85 seconds, matching the initial baseline.
| Rhodafac RE 610 | 0 ppm | 25 ppm | 125 ppm | 250 ppm | 500 ppm | 0 ppm (final) |
|---|---|---|---|---|---|---|
| Foaming time (s) | 86 | 85 | 101 | 191 | 570 | 85 |
| Foam half-life (s) | — | — | 788 | 661 | 465 | — |

Results: Pluronic F127
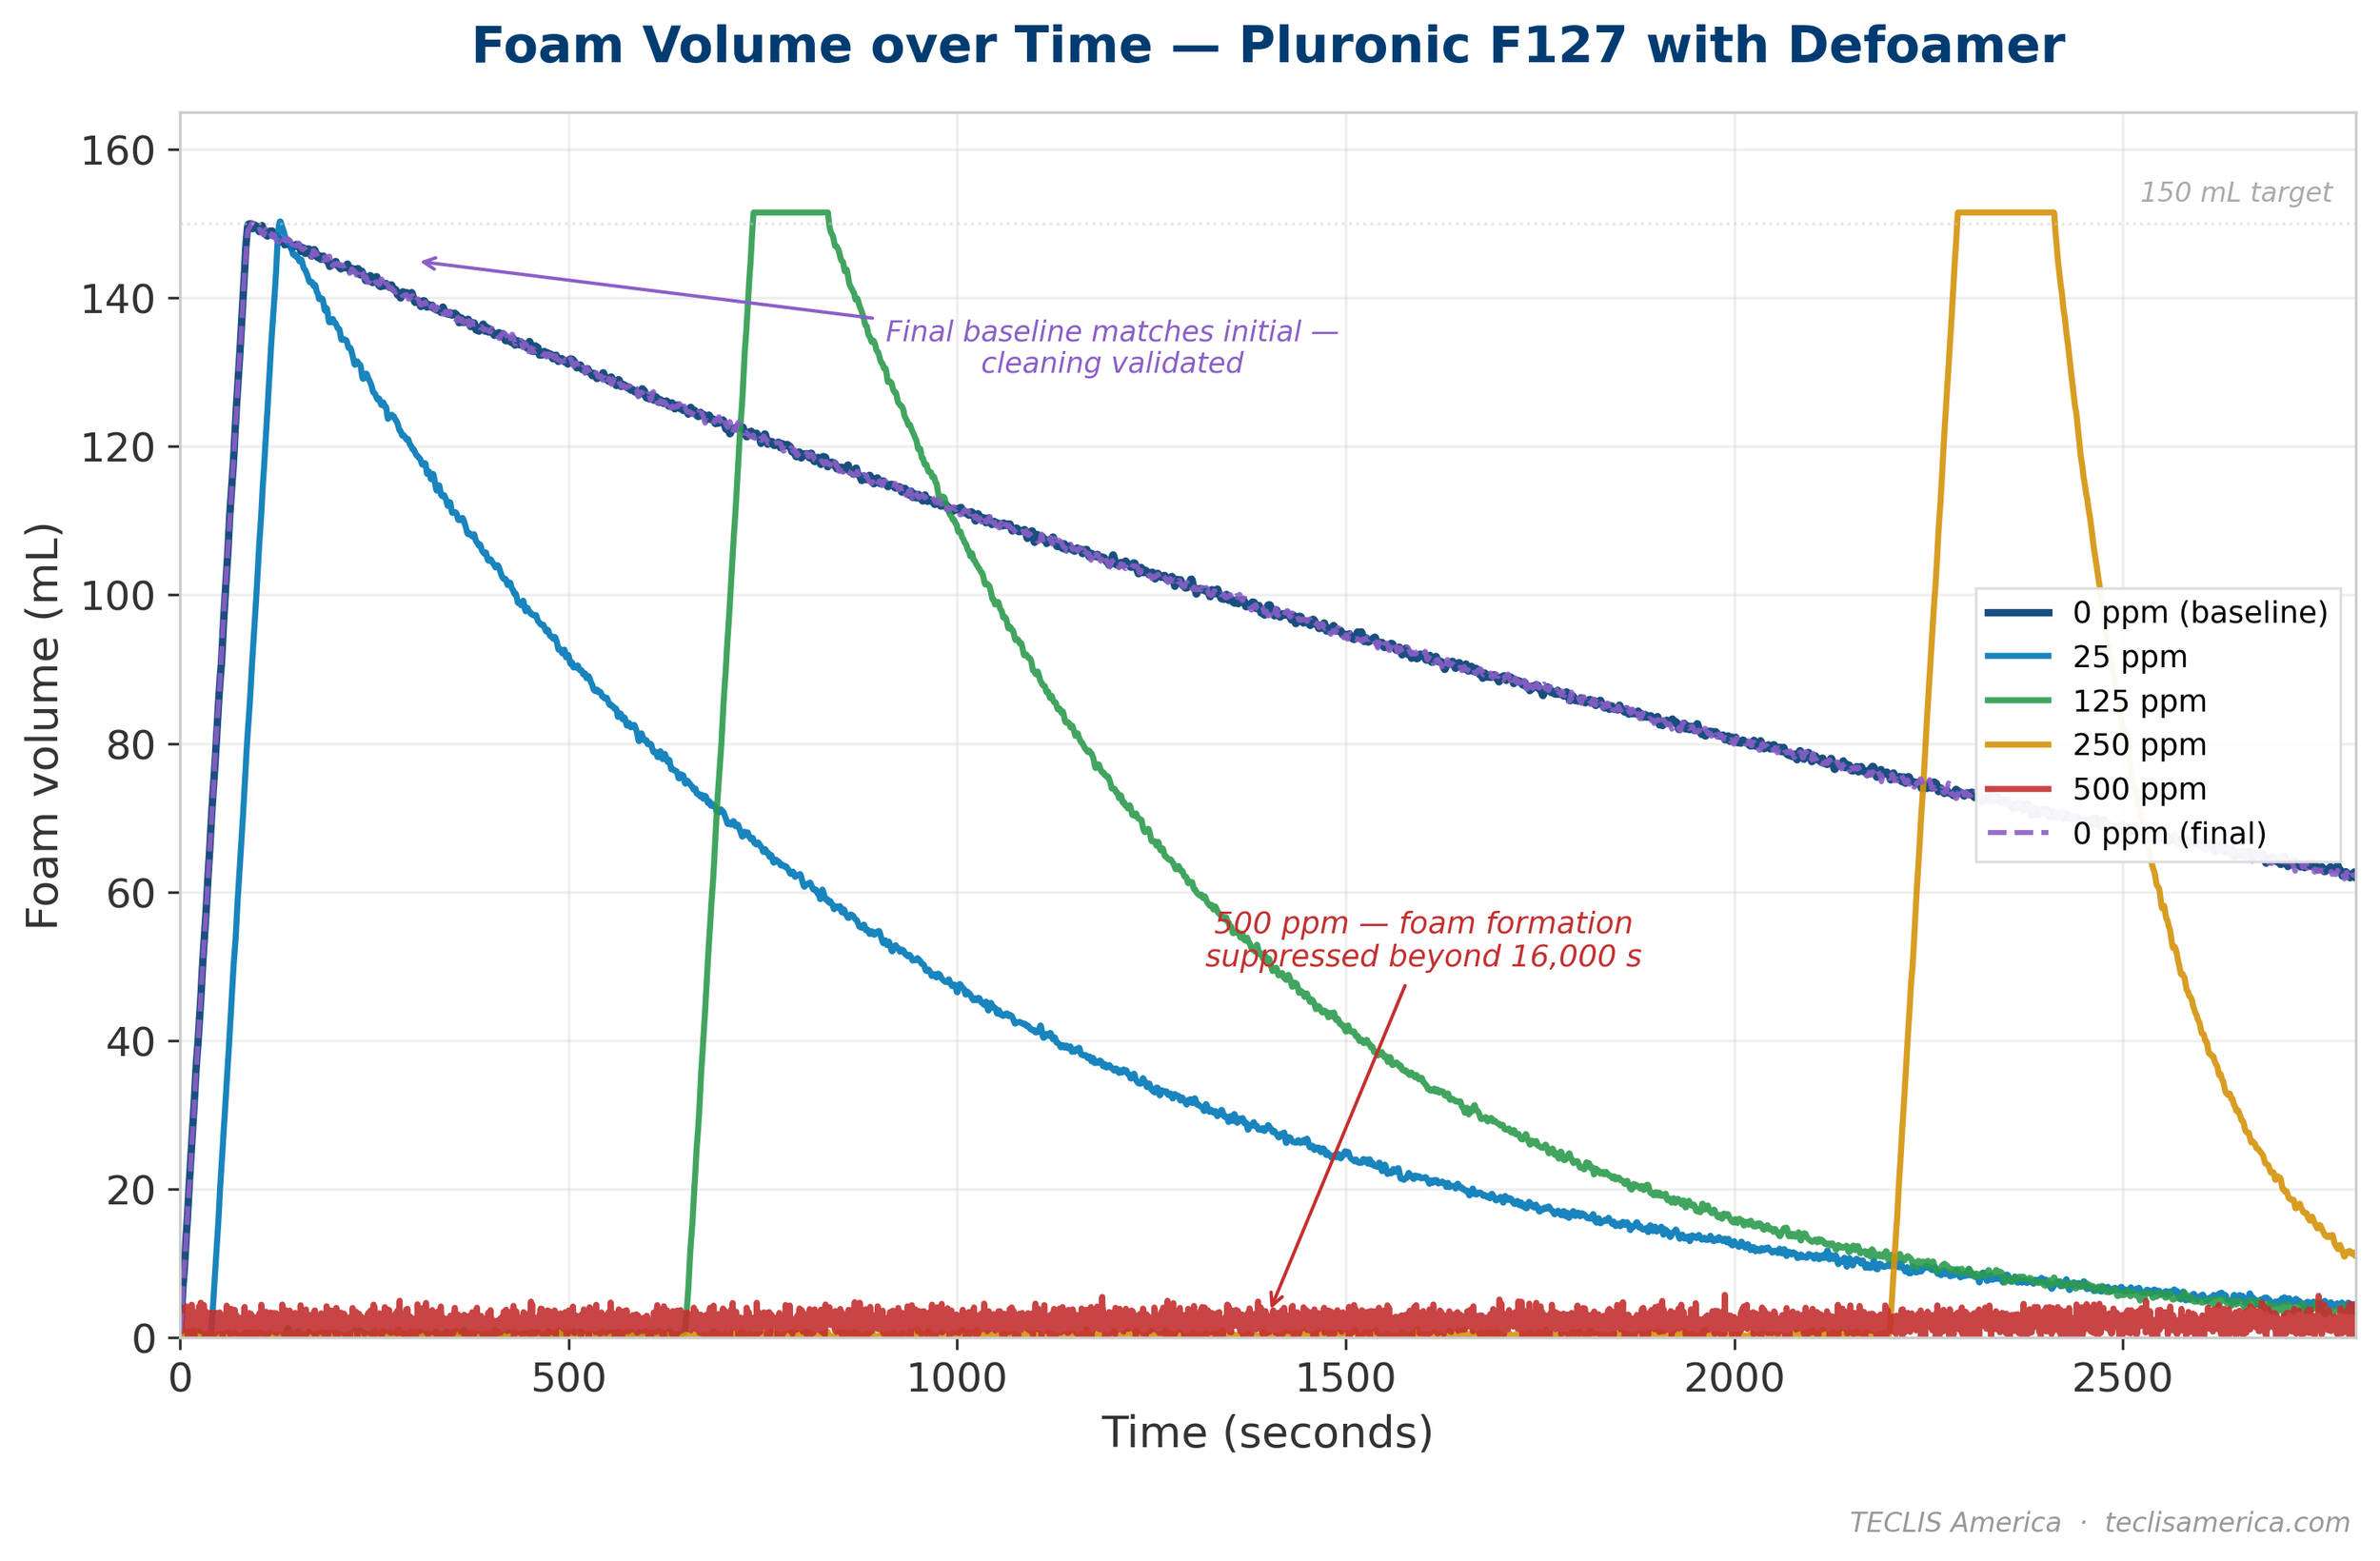
In the Pluronic F127 system, the same defoamer at the same concentrations told a completely different story. At just 25 ppm — the concentration that had no measurable effect in the Rhodafac system — the defoamer was already effective. Foaming time increased from 87 seconds to 128 seconds, and foam half-life dropped sharply from 2,135 seconds to 523 seconds. At 125 ppm, the effect scaled further: foaming time reached 834 seconds (nearly 10 times the baseline), and foam half-life fell to 361 seconds. At 250 ppm, foaming time increased to 2,412 seconds and foam half-life dropped to just 102 seconds.
At 500 ppm, the defoamer achieved essentially complete suppression. Foam formation was delayed beyond 16,000 seconds — far beyond the practical measurement window. At that concentration, the defoamer effectively prevented any meaningful foam from forming at all.
The final baseline measurement — Pluronic F127 without defoamer, run after the 500 ppm experiment and its cleaning cycle — returned a foaming time of 86 seconds and a foam half-life of 2,135 seconds, matching the initial baseline values. This confirmed that no defoamer residue carried over, even after the highest-concentration experiment.
| Pluronic F127 | 0 ppm | 25 ppm | 125 ppm | 250 ppm | 500 ppm | 0 ppm (final) |
|---|---|---|---|---|---|---|
| Foaming time (s) | 87 | 128 | 834 | 2,412 | >16,000 | 86 |
| Foam half-life (s) | 2,135 | 523 | 361 | 102 | — | 2,135 |
How the Defoamer Works — and Why It Matters
One observation from the data that deserves particular attention: in both systems, the defoamer does not change the rate of foam formation once foaming begins. The foam volume curves show that once foam starts to grow, it grows at essentially the same rate regardless of defoamer concentration. What changes is when foam formation starts — the defoamer delays the onset of foaming, not the kinetics of foam growth itself.
This is a meaningful mechanistic distinction. It indicates that the defoamer is not interfering with gas sparging or bubble formation at the frit. It interferes with the surfactant's ability to stabilize foam films — but only up to a point. Once sufficient surfactant accumulates at the newly formed interfaces to overcome the defoamer's inhibitory effect, foam formation proceeds normally. The higher the defoamer concentration, the longer this takes, and for the Pluronic system at 500 ppm, foam formation is effectively suppressed within any practical measurement window.
This kind of mechanistic insight — the distinction between delaying onset and slowing growth — is exactly the type of information that quantitative, time-resolved measurement provides and that visual observation cannot. If you were watching this foam in a beaker, you would see "less foam" or "slower foaming." You would not be able to determine whether the defoamer was slowing the rate of foam generation or delaying its onset, because you would have no continuous, quantitative record of foam volume as a function of time. The formulation implications of each mechanism are different, and the measurement distinguishes between them.
Why the System Matters
The dramatic difference between the two surfactant systems stems from interactions between the defoamer and the surfactant at the interface, governed by the specific chemistry of both components. The Rhodafac solution was prepared at approximately 889 times its CMC, while the Pluronic solution was at approximately 8.7 times its CMC. This means the Rhodafac system contains far more surfactant in excess of the CMC — surfactant that is available to compete for the interface, to solubilize or sequester the defoamer, and to replenish the interfacial film as it is disrupted. The defoamer faces a fundamentally different challenge in each system.
This is not a failure of the defoamer. It is a demonstration of why defoamer testing must be performed in the actual foaming system of interest — not in a model solution, not in water, and not based on a supplier's general performance claims. A defoamer that achieves complete suppression in one system at 500 ppm may require concentrations well beyond that to achieve even a modest effect in another. Without quantitative data from your specific system, you are guessing.
What Quantitative Testing Requires
Three things distinguish a meaningful defoamer evaluation from a subjective one.
First, controlled and reproducible foam generation. If the foam is not created the same way every time — same gas flow rate, same liquid volume, same frit porosity, same temperature — then the variability in your results reflects the variability in your procedure, not the performance of the defoamer. This is the foundation. Without it, no comparison between candidates is valid.
Second, continuous, quantitative measurement. You need to know exactly how long it took to generate the foam (foamability), how quickly the foam decayed (stability), and how these quantities change with defoamer concentration. These are numbers, not impressions. They allow you to construct dose-response curves, compare candidates directly, and identify the optimal concentration for your application. Time-resolved measurements also reveal mechanistic information — such as the distinction between delaying foam onset and slowing foam growth — that no endpoint observation can provide.
Third, clean starting conditions for every experiment. Surfactants adsorb strongly to surfaces. If residual surfactant or defoamer from the previous run remains on the measurement column, the filter, or the tubing, the next measurement is compromised. The effect is subtle — it appears as normal variability, making it difficult to detect and important to eliminate. Automated cleaning between runs, using a programmable multi-solvent sequence that flushes the entire liquid pathway without manual disassembly, ensures that each measurement starts from the same baseline. And as the data in this study demonstrates, a bookend baseline measurement — repeating the no-defoamer condition after the full concentration series — provides direct, objective confirmation that the cleaning was effective.
From Screening to Optimization
The data from a study like this tells you far more than just whether a defoamer works. It tells you where in the concentration range the defoamer becomes effective, how the effect scales with dose, and at what point additional defoamer provides diminishing returns or complete suppression. For the Pluronic system, 25 ppm already produced a significant effect — a formulator could use this as a starting point and fine-tune from there. For the Rhodafac system, knowing that 500 ppm is insufficient to fully suppress foam indicates that this defoamer may not be the right choice for this system, or that a different concentration range, a different defoamer chemistry, or a combination approach should be explored.
This is the difference between defoamer selection as an empirical exercise — trial-and-error guided by experience and intuition — and defoamer selection as a quantitative formulation activity supported by data. Both approaches can arrive at an answer. But the quantitative approach is faster, more reliable, and produces results that can be documented, reproduced, and defended.
How the FOAMSCAN Supports This Work
The measurements described in this article were performed on the TECLIS FOAMSCAN foam analyzer. The FOAMSCAN generates foam under precisely controlled conditions — by gas sparging at a defined flow rate through a porous glass filter, by mechanical stirring at a defined RPM, or by externally generated foam — and continuously measures foam volume, stability, drainage, and bubble size distribution throughout the experiment.
For defoamer and antifoam evaluation, specifically, FOAMSCAN user-defined protocols — gas injection until a target foam volume is reached — are well-suited, as the foaming time to reach that target becomes a direct, quantitative measure of the defoamer's effect on foamability. The instrument executes the protocol identically for every sample, eliminating the operator variability that makes manual testing unreliable.
The automated multi-solvent cleaning system flushes the entire liquid pathway — column, filter, tubing, and drain — between experiments, without manual disassembly and without exposing operators to solvents. This is what makes systematic defoamer evaluation practical: one experiment ends, the cleaning cycle runs, and the next experiment begins from a verified clean baseline.
For laboratories that need to screen many defoamer candidates at multiple concentrations — the kind of systematic evaluation described in this article — the TECLIS JetFoam offers a complementary capability. The JetFoam is designed for high-throughput defoamer performance testing, with an automated carousel that evaluates up to 28 samples sequentially in a single unattended run.
If you are selecting or optimizing defoamers for your process and want to discuss how quantitative foam analysis can support that work, we would welcome the conversation.